Weighting EPA to Improve Prediction
Summary
By weighting certain play types, Expected Points Added (EPA) can be made more accurate than Point Margin in predicting out of sample Point Margin. Even without controlling for strength of schedule, homefield, or any pre-season priors, a weighted EPA can even be more accurate than DVOA, which includes all of the aforementioned data points.
A Refresher on Expected Points Added (EPA)
In a football game, some situations are more advantageous than others. For instance, a team facing 1st and 10 from midfield is in a better position to score than the same team facing 1st and 10 from its own 20. Similarly, that 1st and 10 from midfield is better than 2nd and 10 from the same point. Extending this logic, every down, distance, and field-position combination implies a value that is comparable to the value of any other down, distance, and field-position combination.
Brian Burke’s Expected Points (EP) quantifies these values by modeling the average points that are “expected” to arise from that particular game situation. The closer a team is to its opponent’s end zone, the higher its expected points. If a team is backed up against its own endzone, the opposing team may have a higher probability of scoring next, resulting in negative EP for the team possessing the ball.
Since any game situation implies EP, the value of an individual play can be measured by the difference in EP between its start and end. This metric is called Expected Points Added (EPA).
EPA is, in effect, a method for attributing points scored to individual plays. If the EPA model was perfect, adding together the EPA of every play for a team would result in that team’s final point margin. While the model is not perfect, EPA per play is a fairly accurate approximation of the final point margin:
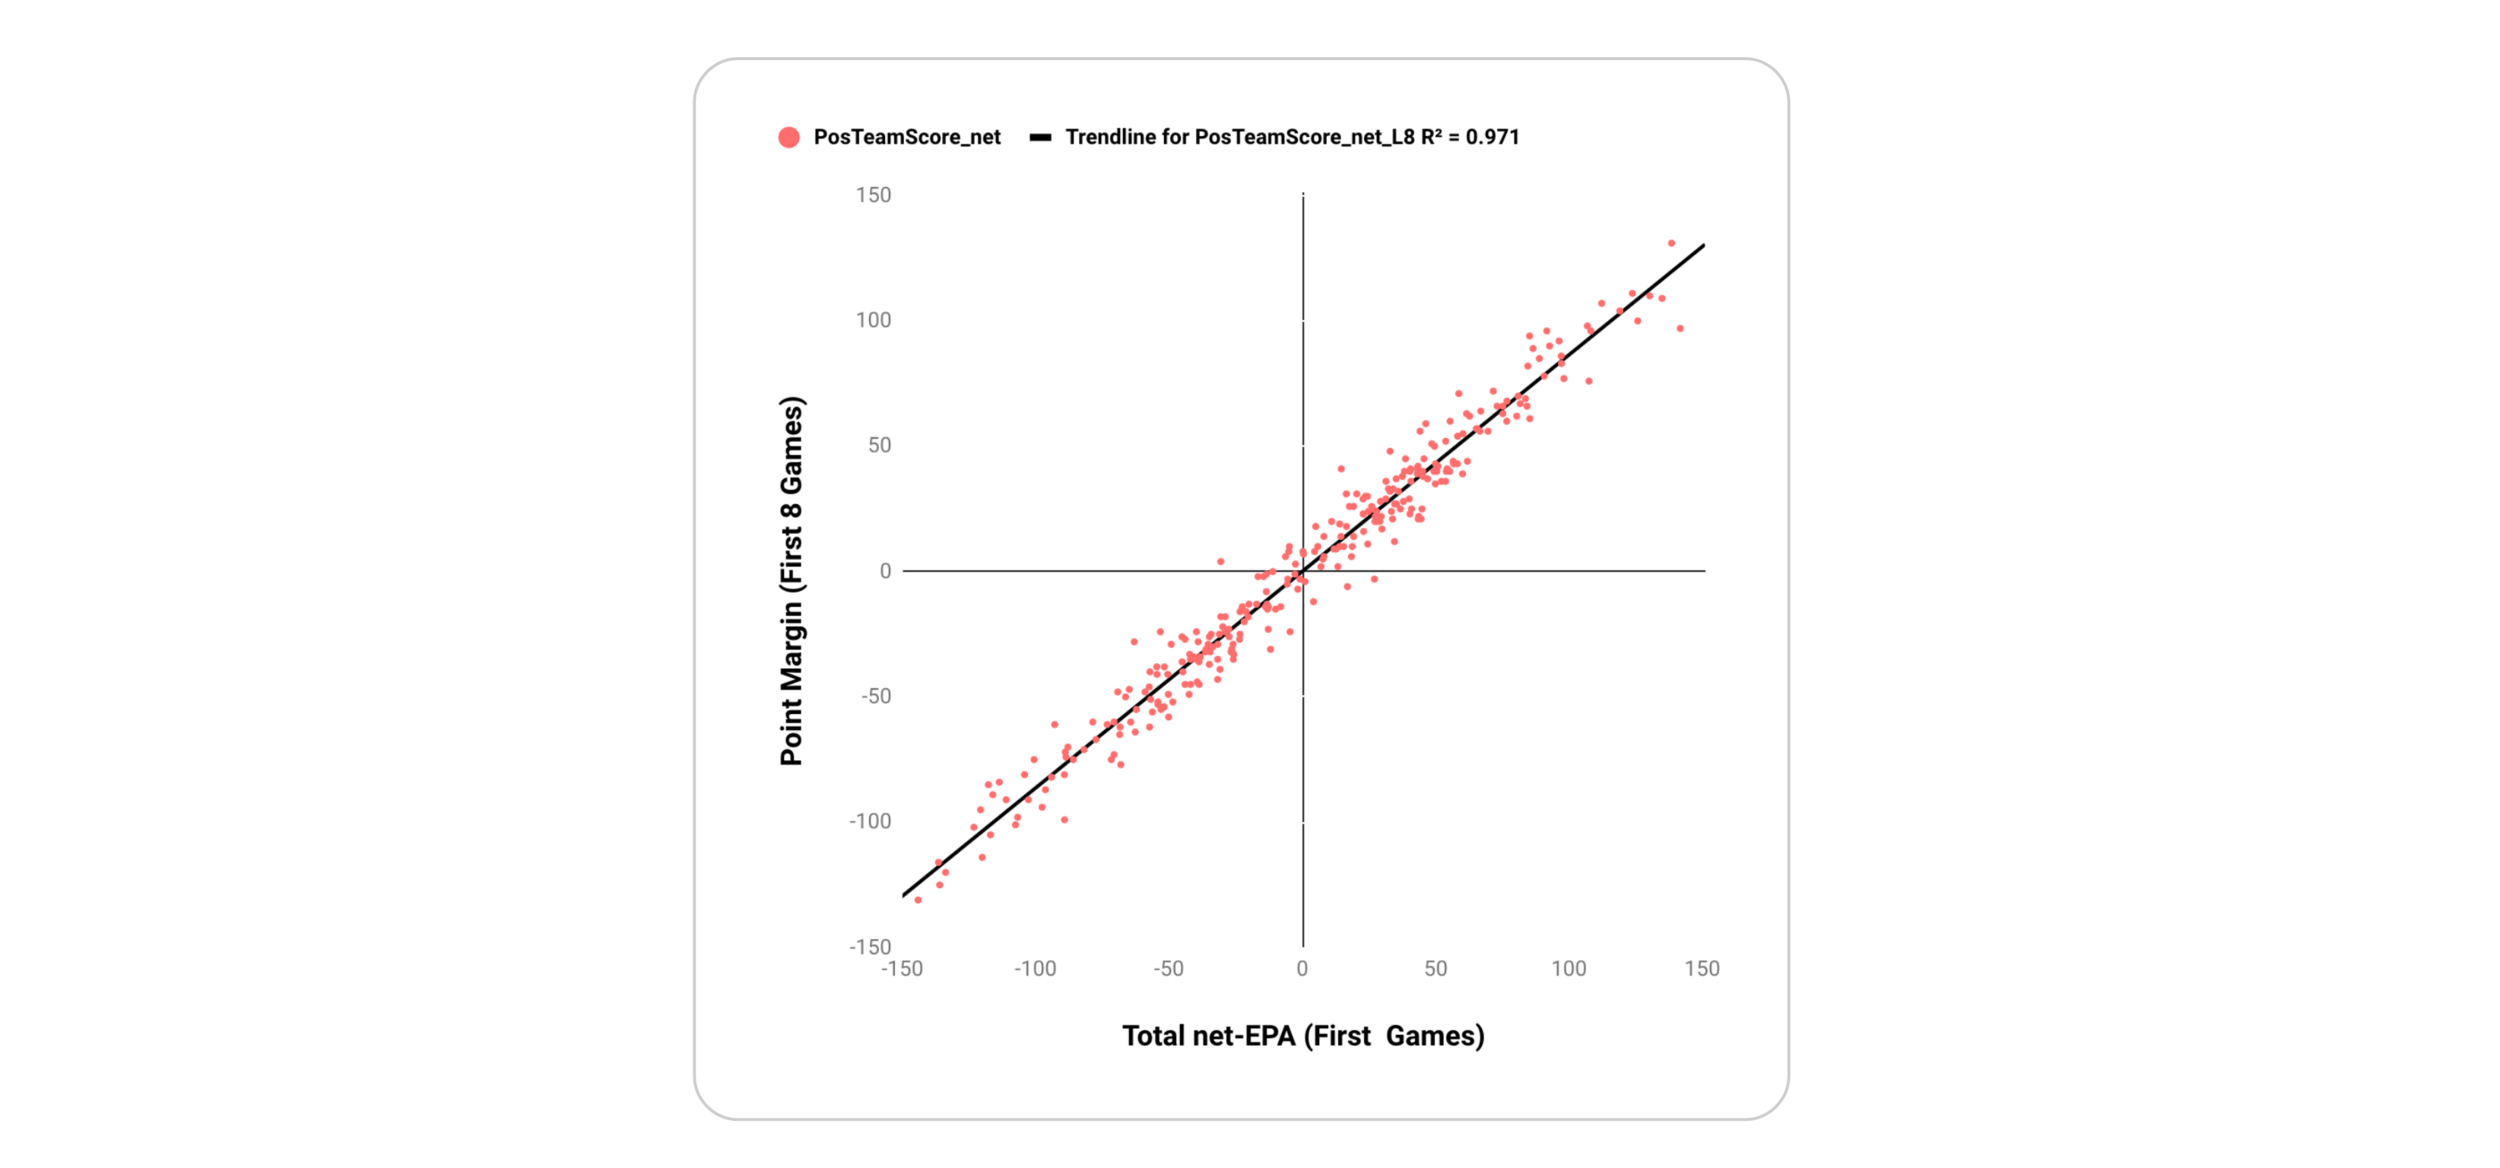
A team’s Total net-EPA (i.e. EPA when possessing the ball less EPA when not possessing the ball) per play has an R^2 with Point Margin of 0.971.
EPA is widely used to measure the per play efficiency of teams and players. An evolution of Burke’s original model is used in the nflscrapR R package, which will serve as the basis for the analysis presented below.
Point Margin, EPA, and Predicting
As shown by @moo12152, a team’s point margin in previous games is correlated to its margin of future games:
Here is the same chart when predicting point differential.
— Moo (@Moo12152) October 30, 2018
The relations are pretty much the same, point differential can be predicted better than wins. Not surprising. pic.twitter.com/pM75LEUzRG
Because net-EPA is a model of margin, it should be expected to be less predictive than margin itself. Point margin has an out of sample R^2 of 0.27 to Point Margin, while Off-Def EPA/Play has an R^2 of 0.24. Though the R^2s are slightly different, the analysis here shows the same:

Like many EPA based analysis, EPA / Play here considers offensive and defensive plays only. By constraining the data set, these EPA analysis effectively weight special teams plays to zero. With special teams weighted to zero, the predictive power of EPA decreases. As additional information is removed from the data set (i.e. Pass Only EPA or Rush Only EPA), R^2 decreases further. However, it is clear that some play types are more predictive than others. Entirely removing special teams plays or rush plays lowers EPA’s predictive power, but it is also possible that only partially down weighting less predictive play types could improve EPA’s R^2.
Leverage and Randomness in Football
Over the course of a football game, some plays impact the result more than others. Field goals, for instance, are uniquely binary events that result in either 3 or 0 points. Unlike other plays, there are no second chances. Missing three reasonable field goals “costs” more than dropping three screen passes, even though the two events have a similar likelihood of of occuring. Field Goals are a high leverage play type.
In addition to being high leverage, plays can also be high randomness. Fumbles, for instance, heavily impact outcome despite comprising a small percentage of plays (high leverage) and do not repeat at a consistent rate in future games (high randomness).
While these plays types directly impact the final point margin, they are not necessarily good indicators of a team’s future performance. By definition, randomness holds no predictive power, and when random events are simultaneously high leverage, they introduce a meaningful noise.
Weighting EPA
If the goal of EPA, is to quantify a team’s performance in a way that is both standardized across games and predictive of the future, then any play type or event that is highly impactful, but largely random should be discounted. Similarly any plays that are highly impactful and likely to repeat in the future should be over-weighted:

Though there are likely many play types that should be weighed up or down, as a proof of concept, the first exploration of a weighted EPA will consider the following:
| Play Type | Narrative & Expected Impact on net-EPA’s Predictiveness | Name in Model |
|---|---|---|
| Defense | Defensive performance is less stable over time. Downweighting defensive plays should improve net-EPAs predictive power | defense |
| First and Second Downs | Third downs are high leverage plays that reward more EPA for the same level of performance. Weighting first and second downs higher should improve net-EPAs predictive power | fs_down |
| Garbage Time | Teams play differently when the game is out of reach. Teams in the lead generally optimize for clock usage and try to prevent big plays. EPA is not modeled to be aware of these game situation. Down weighting plays when win probability is lower than 5% or higher than 95% should improve net-EPAs predictive power | garbage_time |
| Non-sack Fumbles | Fumble rates are generally consistent across teams for each play type, with Sacks having the highest rate by a margin. Because pressure allowed is a stable metric, fumbles from sacks hold some predictive power. Downweighting all other fumble types should improve net-EPA’s predictive power | ns_fumb |
| Red Zone | Like third downs, red zone plays are high leverage and reward performance more than other parts of the field. Down weighting plays in the red zone should improve net-EPAs predictive power | red_zone |
| Run | Compared to passing, running impacts the game less and is less stable over time. Downweighting running plays should improve net-EPAs | run |
| Special Teams | Special teams plays can be high leverage and not necessarily stable (like a run of missed field goals), but the ability of a good punter, place kicker, or returner to shorten the field is also potentially stable. Down weighting special teams should improve net-EPA’s predictive power, but only slightly | special_teams |
| Penalties | Penalties can make or break drives, and are the result of some level of referee subjectivity. By downweighting penalties, net-EPA’s predictive power should be improved | penalties |
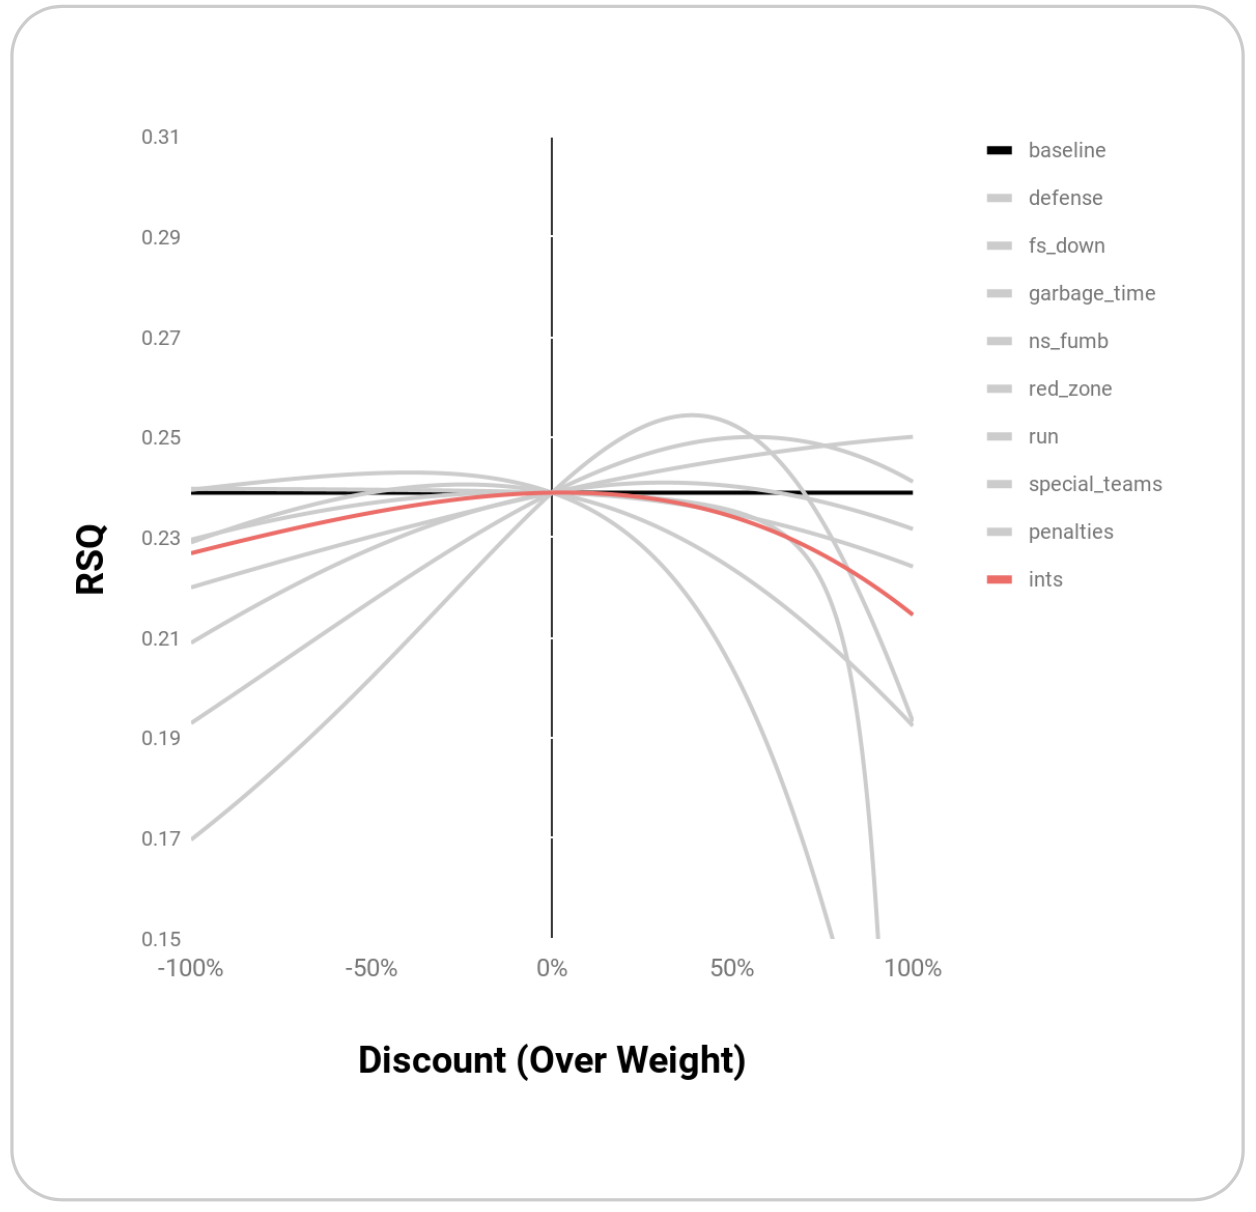
| Interceptions | Like fumbles, interceptions are high leverage events that occur infrequently. Unlike fumbles, interceptions are relatively stable, as better quarterbacks turnover the ball less. Downweighting interceptions should decrease EPA’s predictive power | ints |
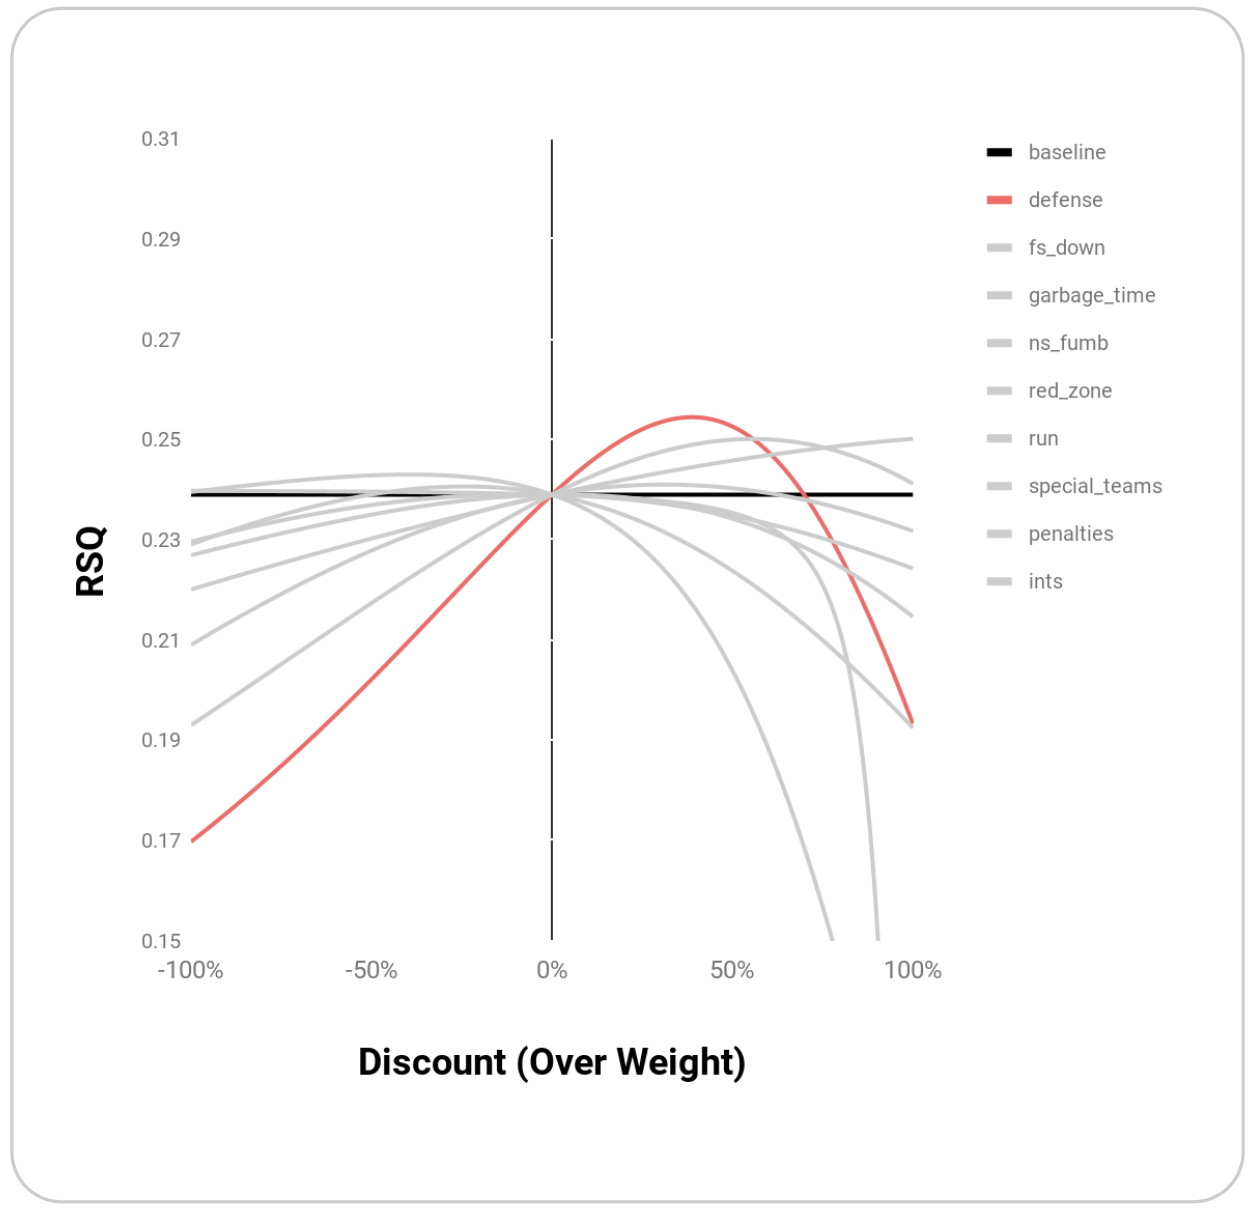
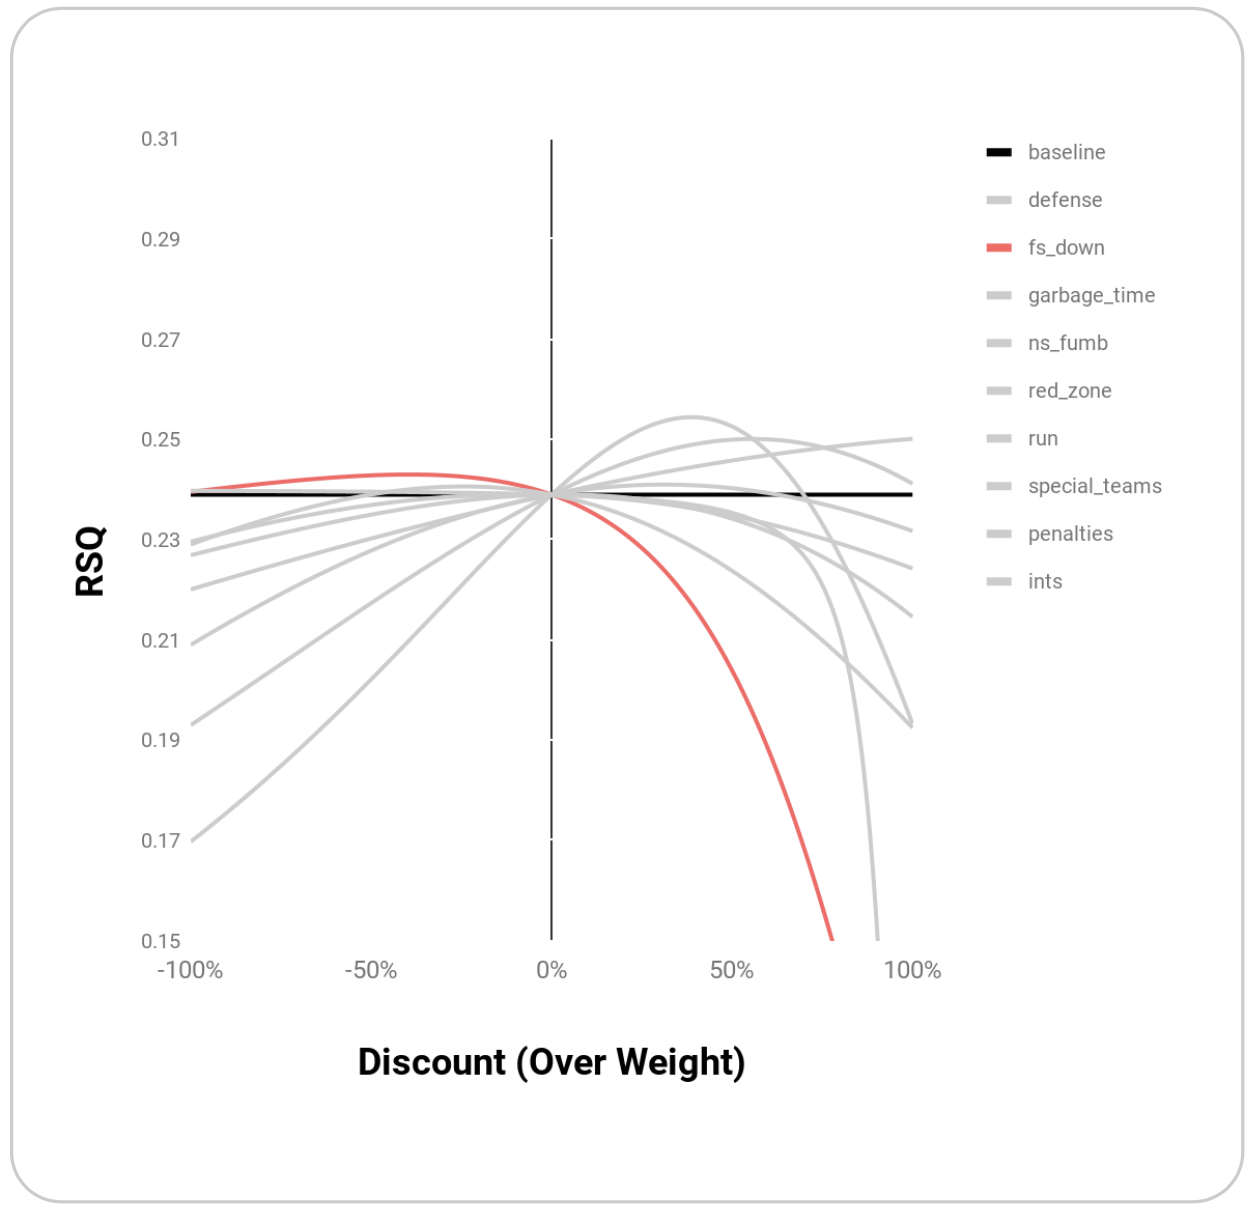
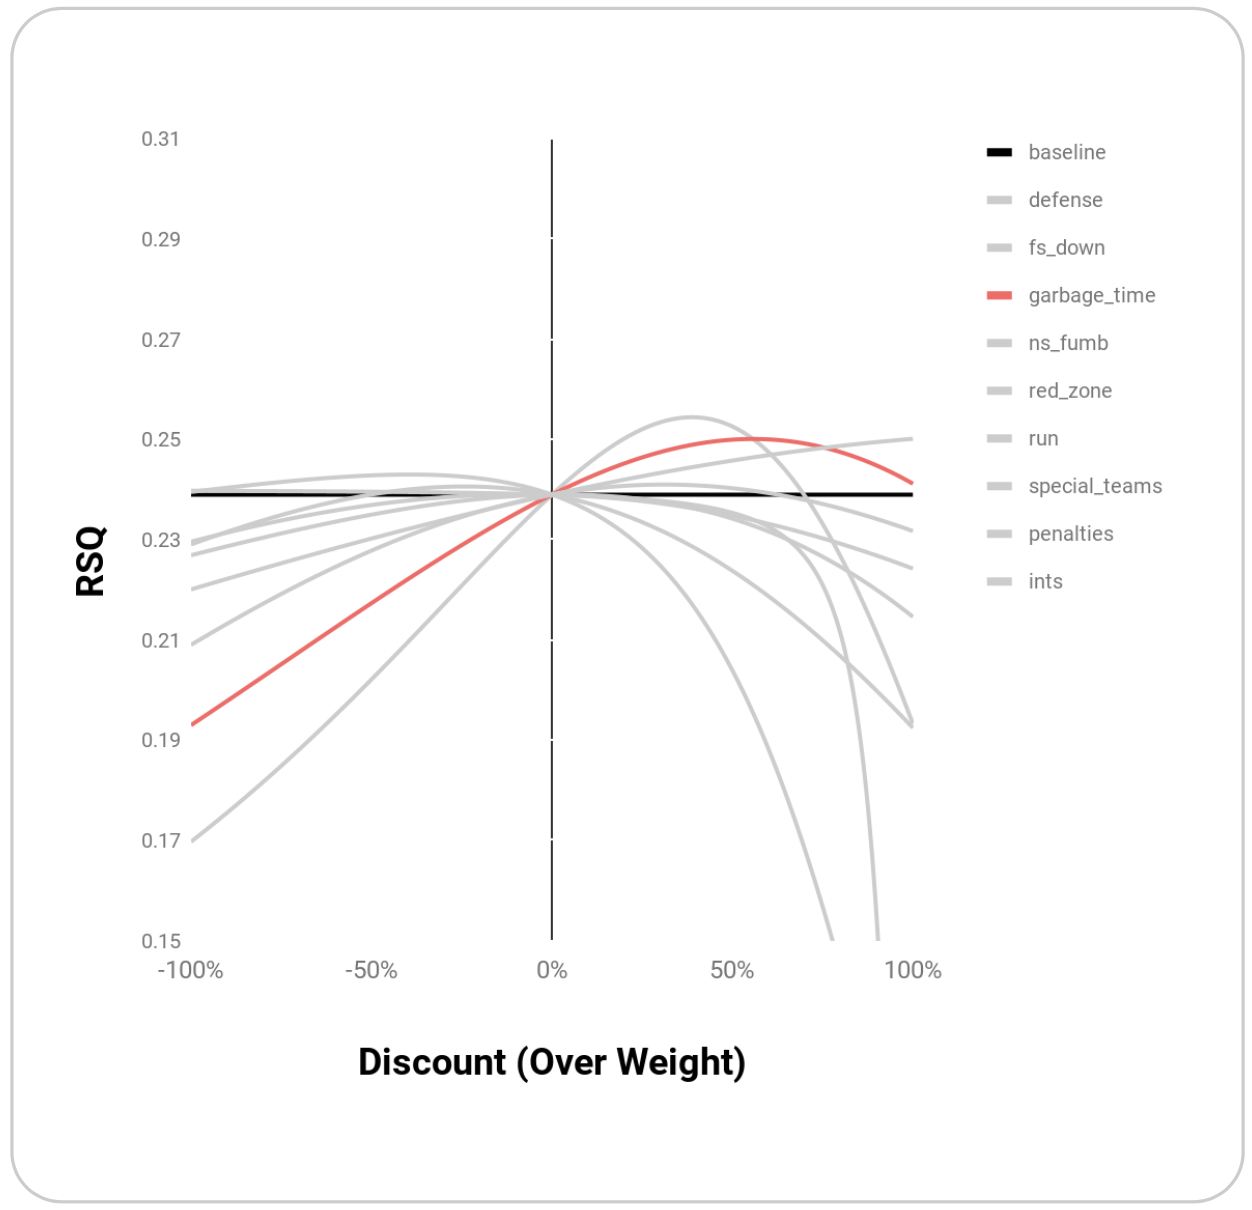
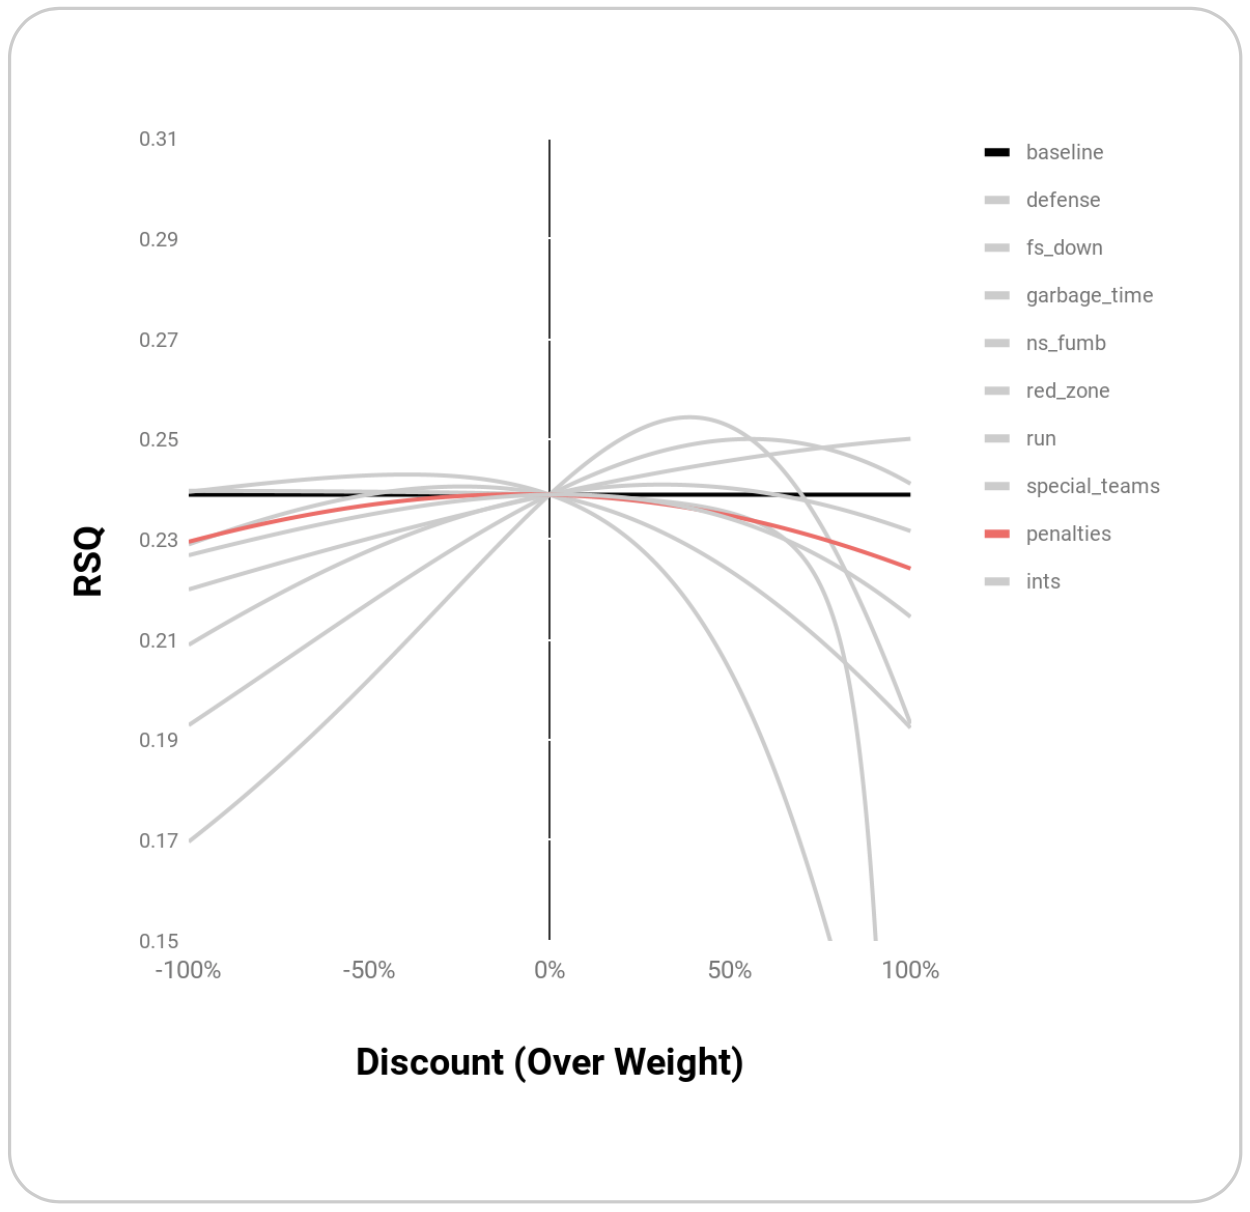
Using out of sample R^2 as a barometer of a metric’s predictive quality, the “best” weighting can be considered the one that maximizes R^2, and the overall effectiveness of weighting a specific play type can be measured by its R^2 relative to the baseline of an equally weighted EPA.
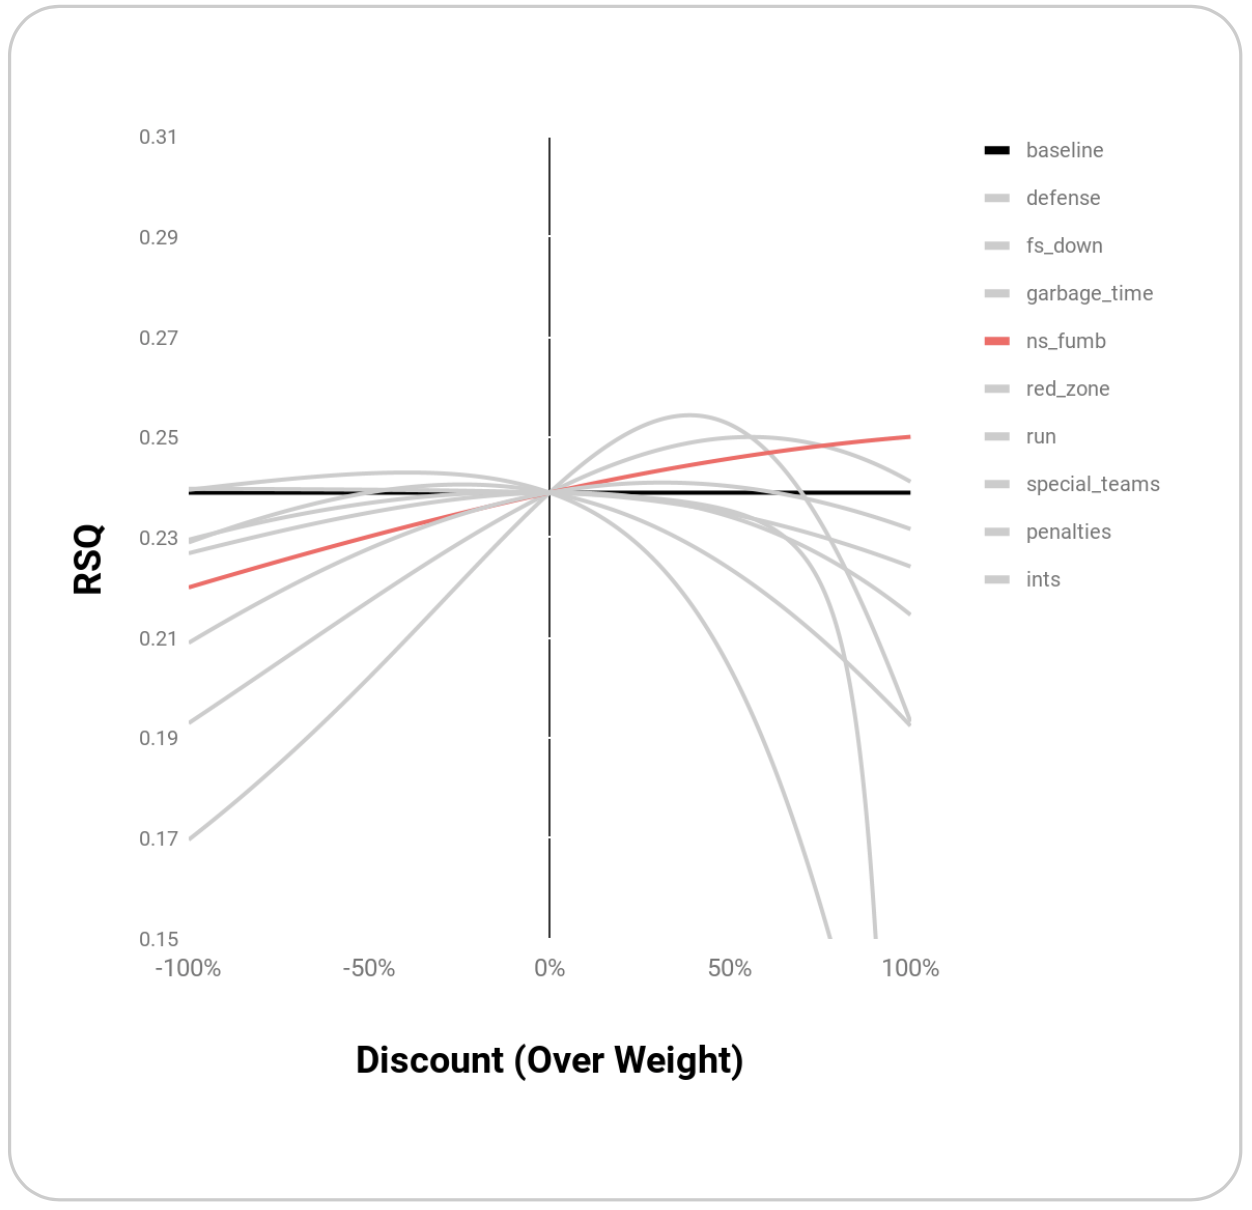
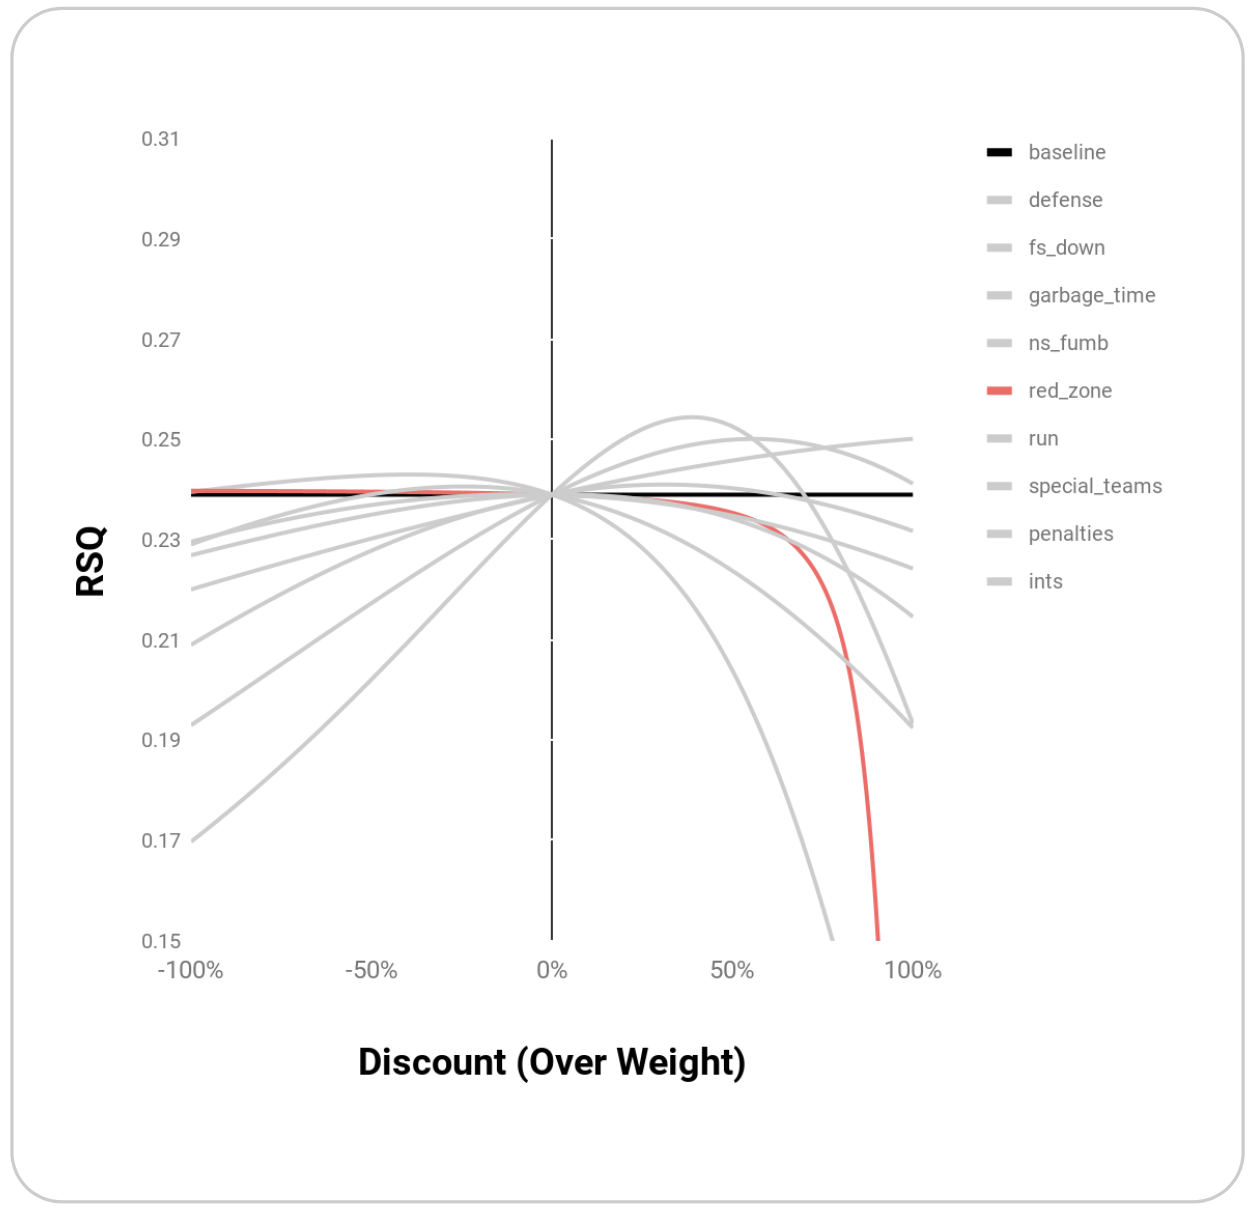
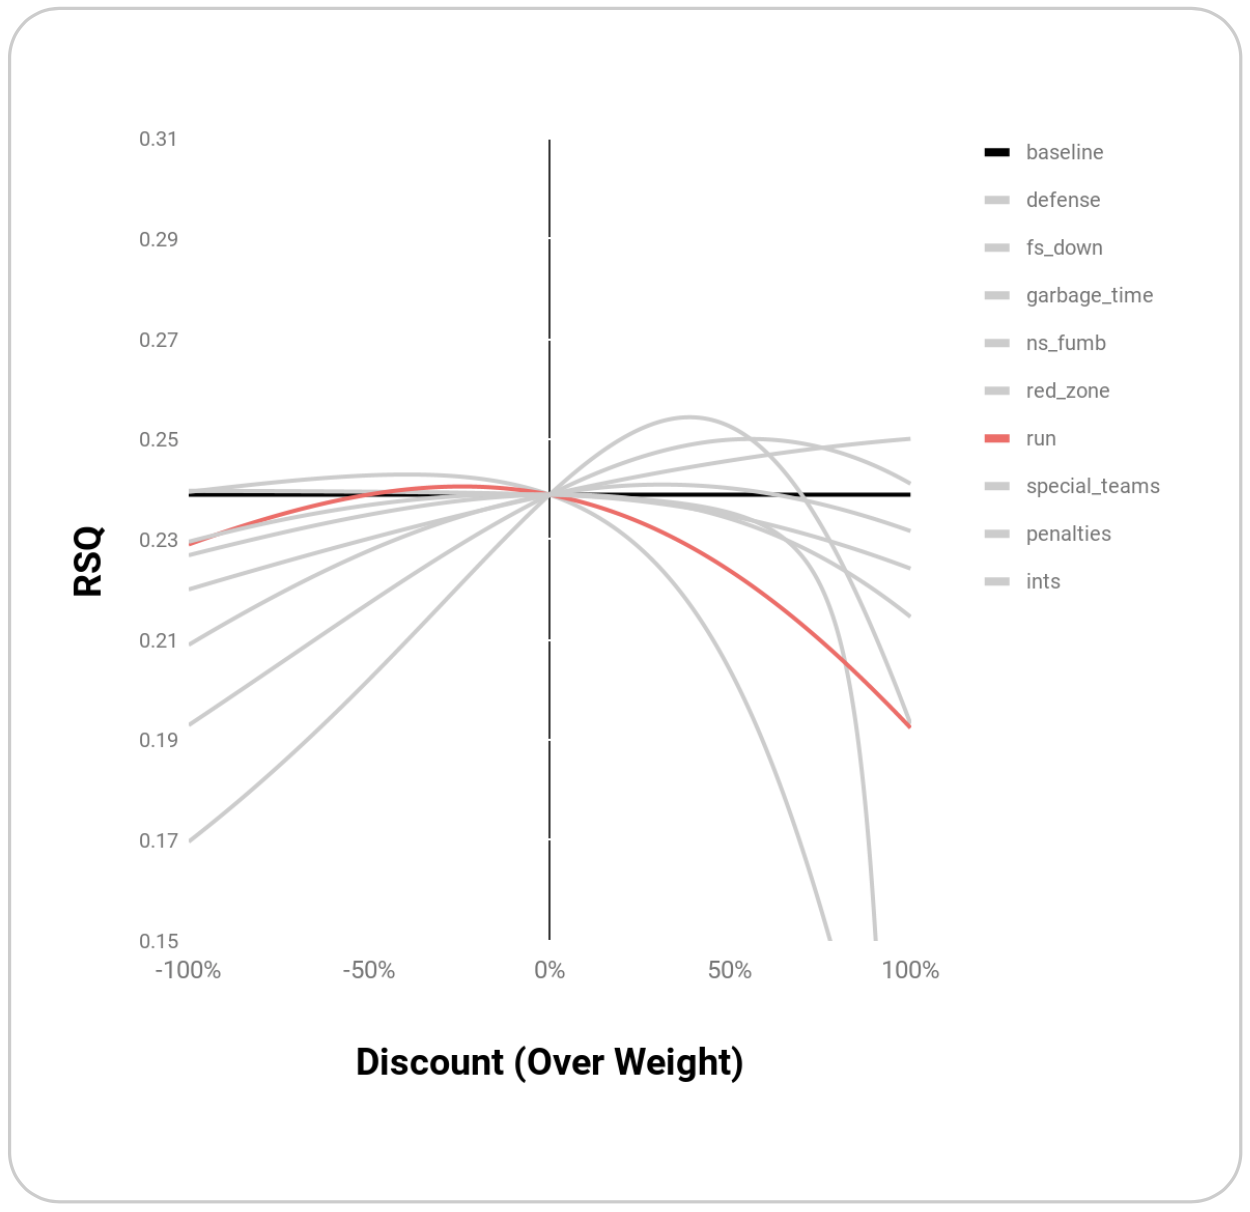
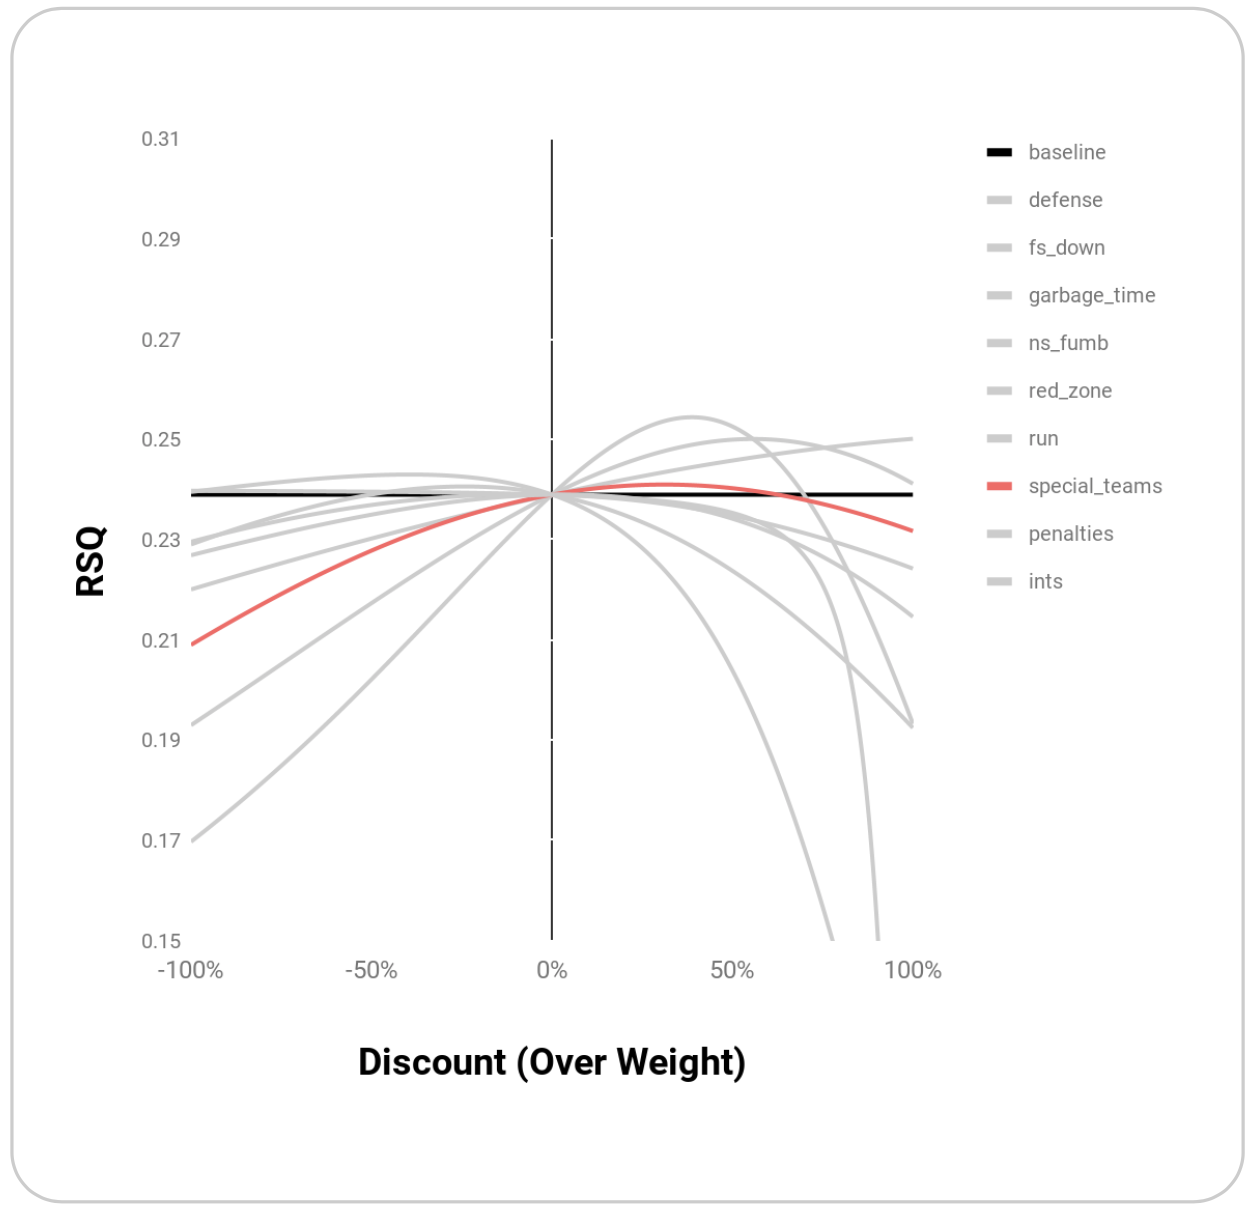
Within the set of play types outlined above, EPA’s R^2 benefits most from weighting Defense, Downs, Garbage Time, and Non-Sack Fumbles:
| Play Type | Max rsq | Discount (Premium) |
|---|---|---|
| defense | 0.254 | 0.39 |
| ns_fumb | 0.250 | 1 |
| garbage_time | 0.250 | 0.56 |
| fs_down | 0.243 | -0.39 |
| special_teams | 0.241 | 0.31 |
| run | 0.241 | -0.24 |
| red_zone | 0.240 | -1 |
| penalties | 0.240 | -0.08 |
| ints | 0.239 | 0.03 |
| baseline | 0.239 | -1 |
Graphically, these points appear to be maxima rather than random points where R^2 is maximized:
Melding these top weightings together through simple multiplication yields an even higher R^2 of 0.27:

Comparison to Other Models
Weighting EPA improves the predictive quality of the model and exceeds the R^2 of Point Margin. In addition, Weighted EPA’s out of sample R^2 for Point Margin in the second half of a season is higher than DVOA, which (for right or wrong) is often used as a benchmark measuring team performance:

Even without controlling for strength of schedule, homefield, or any pre-season priors, Weighted EPA ‘s R^2 is 0.270 vs 0.263 for DVOA, which includes all of the aforementioned data points.
Conclusions and Modified EPA
Weighting works because EPA is unaware of leverage and randomness. While correcting for these events improves EPA’s predictive quality, it does so in a way that is susceptible to overfitting. Finding weights that maximize R^2 in this data set won’t necessarily maximize R^2 over future data sets, which is the only R^2 that matters. A better way to attack the problem would be to change EPA itself.
EPA measures the expected value generated by an individual play, but ignores the likelihood that a play will unfold the way that it did. A tipped pass that falls harmlessly incomplete may often instead result in a costly interception. EPA would become more representative of performance if it captured these probabilities.
The future of this project will use the degree to which a play type can change R^2 as a signal that the EPA model for those play types could be modified to improve EPA’s measurement of performance. For instance, this diagram details how a fumble’s EPA could be modified:

In addition to building a more accurate EPA, this project will seek to incorporate EPA into models that include home field advantage, strength of schedule, preseason prior, etc, to build a more robust power ranking system that can predict individual plays.
For links to the scripts used or questions in general, feel free to contact me on twitter @greerreNFL