Jawbone Up Data Visualization and Insights
Over the last two or so years, health and fitness trackers have evolved from data collectors for the curious to ubiquitous accessory for everyone. Despite a huge upswing in adoption for these products, many customers have been returning their devices. In fact, an Endeavour Partners report from 2014 suggests a third of fitness wearable owners stop using their device within six months, and a half of all fitness wearable owners stop using their device eventually. One of the biggest reasons for low wearable retention rates is the lack of insight that they provide. Users who fail to glean actionable insights from their fitness trackers are unlikely to see a change in fitness levels and will eventually abandon the fruitless device.
As a long time and religious user of both the Withing's Smart Body Analyzer and JawboneUP fitness tracking lineup, I thought it would be interesting to visualize my data sets to see if I could generate any actionable takeaways.
Having both fitness and weight data, the logical place to start this analysis was a comparison of the two. This is a chart comparing the rolling 14-day averages for total weight and daily calories burned by way in which they were burned (Passive, Active, or Workout):
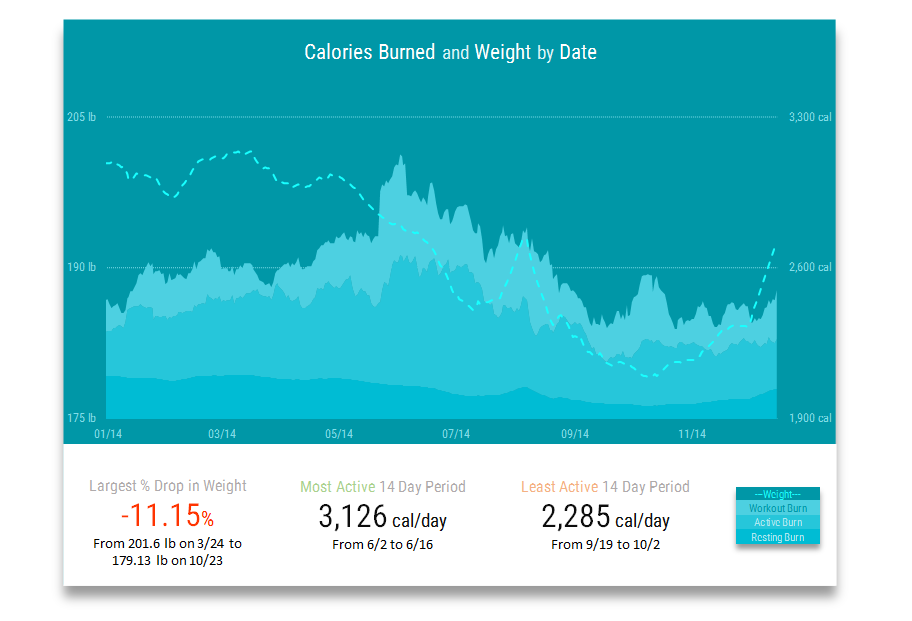
JawboneUp Calories Burned and Withings Weight by Date
A few important notes:
Calories burned are tracked in three ways:
Passive - these are the calories that your body burns when you are doing nothing. Just staying alive requires your body to burn a significant amount of energy. Passive burn represents the largest proportion of total burn.
Active - these are calories that your body burns when you are doing something active, but are not explicitly working out. For instance, walking from point A to point B, or even standing and doing the dishes.
Workout - these are calories that are explicitly being tracked and tagged as "workout" calories. These calories are high intensity and are highly variable in terms of their proportion share of total burn.
Jawbone can track workouts, but it doesn't currently track the total calories burned during a workout. It will only display Passive Burn & Time, Non-Passive Burn & Time, and Workout Time. To estimate Workout Burn, we first found the average Non-Passive Burn per second by dividing Non-Passive Calories Burned by Non-Passive Time on days when no workouts occurred. For a given day, we could then subtract average Non-Passive Burn per second * (Non-Passive Time - Workout Time) from total Non-Passive Burn:

Formula for calculating calories burned during a workout with the JawboneUP
The chart reveals several interesting facts. Even during my least active stretches, my Passive Burn kept my Total Burn above the 2,000 calory threshold at 2,285. During my most active periods, I burned almost 900 calories more per day, or roughly one Big Mac and Medium French Fries worth (860 calories). To provide some prospective to that number, to burn 860 calories, a 200 pound person would need to run at 6 mph for 54 minutes.
The second, and perhaps more interesting takeaway form the chart above, is that weight loss and calories burned actual moved together. The more calories I burned, the heavier I was. Does this mean that exercising made me heavier? Thinking about the data in that fashion would be obvious logical fallacy. Perhaps instead, the heavier I was, the more I decided to exercise and therefore burn. This chart shows calories burned plotted against weight along with a least squares regression line:

JawboneUP calories burned and Withings Weight regression
The relationship between average weight over a 14 day period and average calories burned over the same period is mild (only 16% of the changes in calories burned can be explained by changes in weight), but it is statistically significant. It is not difficult to think of factors that could explain fluctuations in calories burned--free time and location seem to be obvious candidates--but it is clear that at least some of the relationship is the result of weight. Speaking from both the data and the experience of stepping on a scale every morning, being above or below a target effects motivation, which in turn effects outcome. Another way to think of this concept is to compare calories burned to day of the week.
Personally, my goal is to exercise five times a week and I tend to be more motivated to complete those five workouts between Monday and Friday. The chart below shows average calories burned by type and by day of the week. The chart also shows the percentage of those days that a workout occurred, represented by the dotted line.

JawboneUP Calories Burned by day of the week
Not surprisingly, the most active day of the week is Monday as I try to start off the week well. On average, Mondays see just over 100 extra calories burned versus all other days. Despite having the highest level of calories burned, Monday's are not the most likely day for a workout to occur, implying that the Monday workouts are either longer or of higher intensity. Overall, workouts are most common on Tuesdays, which average a workout 82% of the time. Workouts are least likely to occur on Sundays, which only average a workout 13% of the time. Though Sundays are 6.12 times less likely to see a workout, they also only see 281 fewer total calories burned, which begs the question, how effective is exercise at burning calories?
This data set holds two types of workouts--Cardio and Cardio + Weights. Cardio workouts are predominantly sports related like basketball or hockey. Cardio + Weights workouts are a mixture of a shorter cardio exercise like a run or bike ride and a circuit training weight session targeting a particular muscle group. The chart below shows total calories burned in a day by type (Passive, Active, or Workout) and Workout Performed (None, Cardio Only, or Cardio + Weights).

JawboneUP calories burned by workout type
Clearly more calories are burned on days with workouts than on those without. Workouts tend to add 369 calories burned to each day. More surprising is the fact that there is no meaningful difference in terms of calories burned between workouts that are Cardio Only and workouts that are Cardio + Weights. The average Cardio Only workout burns 388.9 calories in 42.3 minutes while the average Cardio + Weights workout burns 389.9 calories in 42.1 minutes. In total, 390 calories for a lunch hour's worth of rigorous physical activity doesn't seem like that much, especially when comparing it our original Big Mac example. Given this rate of burn, it would take roughly an hour and a half to work off a #1. It stands to reason that burning calories is a less effective way to decrease net calories than avoiding the calories an exercise would burn all together. So how effective is exercise in effecting weight change?
Below is a chart that plots daily percentage weight changes by total calories burned in the previous day.

As expected, there is a negative relationship between calories burned and percentage chance in weight the next day. Roughly 13% of the daily change in body weight percentage change can be explained by the change in total calories burned in the previous day, meaning, burning more calories in a given day will increase the expected weight loss for that day. If 13% of scale's change can be explained by calories burned, what explains the remaining 87%? Does a low R Square mean that calories burned, and therefore by proxy time spent exercising, are not important factors to consider when predicting weight loss? Many, many, things could fit into that 87% like, sleep, nutrition, hydration, and stress levels to name a few. However, a "low" R Square doesn't necessarily mean that exercise ins't important. If for instance sleep, nutrition, hydration, and stress levels each had individually lower R Squares, we may conclude that exercise is the most important contributor to weight loss of the bunch.
In reality, fitness trackers have seen low retention rates because personal fitness and health are wildly complex issues that require models with many inputs to measure. If only 13% of what we care about can be explained by what the current generation of fitness trackers measure, why would we expect these devices to have high retention rates in the first place?
Even though the data is a bit rough, and the analysis available a bit limited, a few actionable observations for improving personal fitness can be made from this study:
- Motivation - Whether it is exercising more or eating better, no one is going to go the literal or proverbial extra mile without the proper motivation and a daily reminder. Personally, this reminder was as simple as a daily weigh-in, but each individual is likely to have a different one--Go out and find it.
- Workout Agnostic - It doesn't really matter what type of exercise is performed. If you are pushing yourself, there is a level at which you will burn calories regardless of what you are doing. Find things you enjoy and be honest about the effort you put into them.
- Avoiding > Burning - It is multiples more difficult to burn calories than it is to gain them. Thinking evolutionarily, this makes sense. The human body was designed to maximize the energy it received from food while minimizing the energy it took to acquiring acquire it. We are better at storing than burning, so don't store it in the first place.